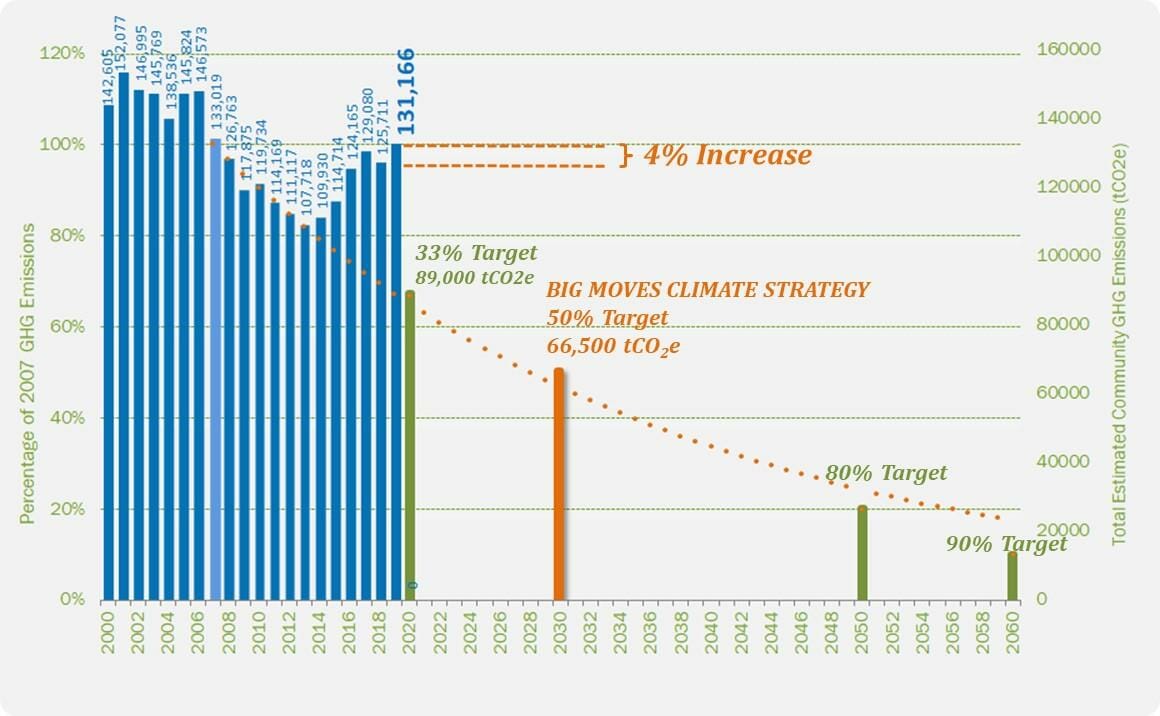
Whistler’s GHG emissions reduction target is to reduce emissions by 50% below 2007 levels by the year 2030. This means that by 2030, our annual emissions would not exceed 66,500 t-C02e.

Sector emissions
The vast majority of Whistler’s emissions are from vehicle transport and the built environment. As such, to make effective progress towards Whistler’s climate commitments, actions must focus on these two aspects of our community. Below is a brief description of the current situation in these two areas, as well as the waste sector.
Personal transport is Whistler’s biggest source of GHG emissions, accounting for 54% of the community’s total. Importantly, it is also the only major sector in which emissions have been increasing, with emissions growing by 12% since 2007. It explains 85% of the total gap towards Whistler’s 2020 climate targets. It is important to note that Whistler only measures transport related emissions that occur within its municipal boundaries and does not account for inter-community travel.
Buildings account for 38% of Whistler’s emissions, with natural gas usage in commercial buildings representing 25% and in residential buildings 10% of the total. Emissions have declined by 6% in this sector since 2007. However, it is important to note that much of the GHG improvements have come from one-time, non-repeatable circumstances, including the declining GHG intensity of hydroelectricity and Whistler’s shift from propane to natural gas. Recently, natural gas connections have increased due to declining costs, with residential connections up by 25% and commercial consumption up by 21% in the past 5 years, creating a barrier to long-term progress
Waste is Whistler’s best performing sector with emissions declining by 90% since 2005 due to the gas capture and destruction at Whistler’s past landfill, as well as increasing organics diversion. These initiatives significantly reduce methane emissions from landfills which are the primary source of GHG emissions related to waste.
What is realistic?
Both the City of Vancouver and the Community Energy Association whose works have informed the above Big Moves have set 2030 targets of 50% reduction (below 2007 for City of Vancouver). This is in line with IPCC recommendations to help stabilize climate change at no more than 1.5 C above pre-industrial levels. Given the challenges with meeting Whistler’s 2020 targets and the limited tools available to local governments, reducing emissions by 50% in just ten years is a stretch goal for Whistler even with extremely ambitious action. The City of Vancouver has substantial additional jurisdiction and tools at hand that the RMOW does not have, such as being able to set GHG intensity measures in its building code, or specifying the type of heating and hot water equipment that can be installed in new and existing buildings. Until Whistler has similar jurisdictional authority to more effectively address emissions within Whistler, we focus on achievable short-term targets while advocating for the legal tools needed to ultimately close the gap to achieving our ambitious 50% target
Estimated impact of the Big Moves
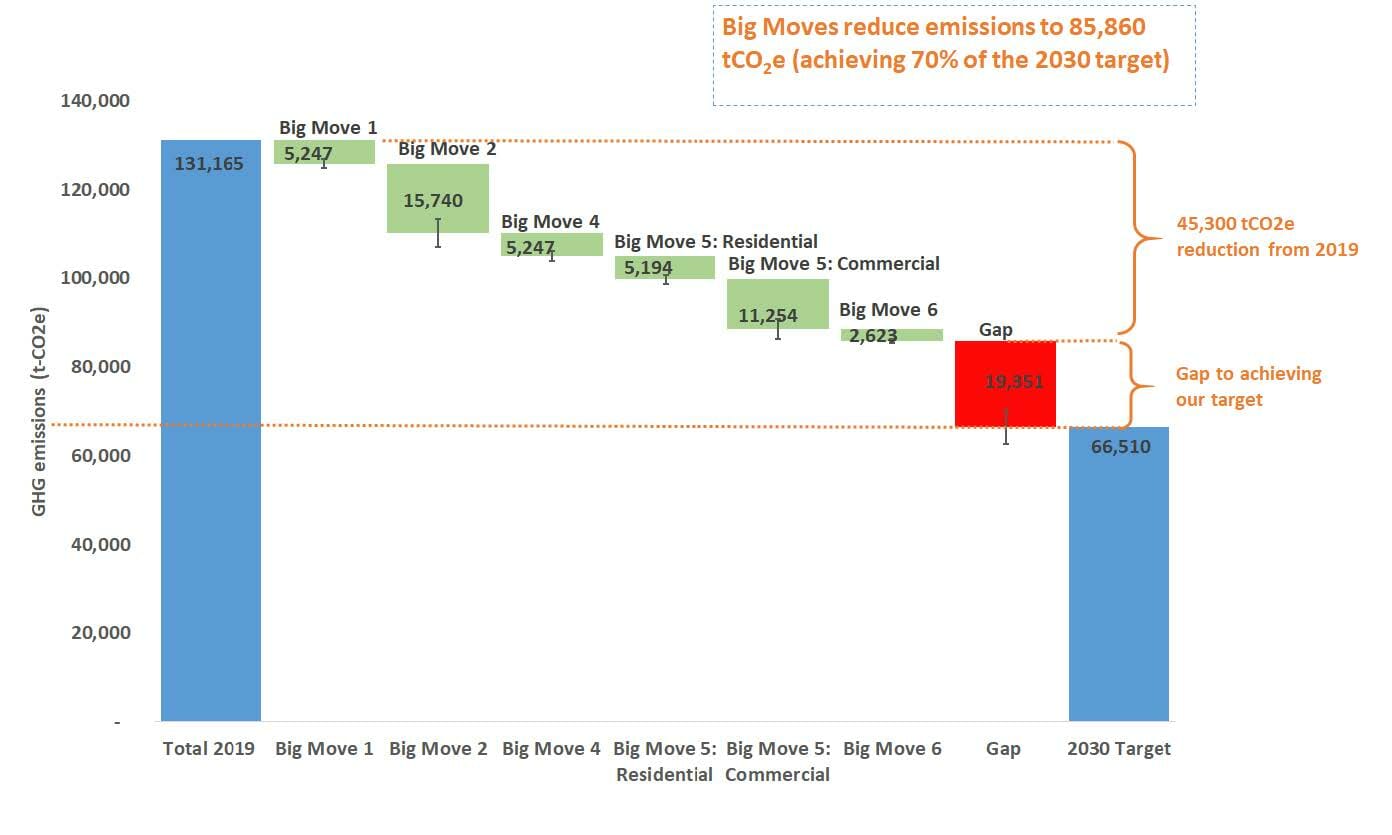
Whistler’s Big Moves are ambitious and it is estimated that, if successfully achieved, they will reduce emissions by 45,300 tCO2e compared to 2019, resulting in 2030 emissions of around 86,000 tCO2e, which is 70% of the way to the 50% reduction target.
Figure 4 shows the estimated impact of each Big Move by 2030. Note that while the proposed target is based on 2007 emissions, reductions for each Big Move are calculated based on 2019 data which is the last emission inventory year prior to implementing the Big Moves. In addition, GHG emission reductions in percentage are calculated using a Business as Usual (BAU) scenario following the Community Energy Association’s (CEA) Climate Action Planner tool5.
All emission reduction estimations are given as a range due to the high uncertainty and necessary assumption for these calculations. The lower and upper limit of the emission reduction ranges are based on a conservative and optimistic climate action scenarios that assume that trends on technology, funding availability, Provincial and Federal action, and public interest and pressure to decelerate or accelerate, respectively.

Contact
Climate and Environment
climatechange@whistler.ca


